
Completion Date
6-1-2013
Advisor
Matthew Kelly
Abstract/Description
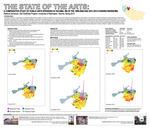
Introduction:The impact of the arts on a community is an exceptionally difficult thing to measure; the return on investment can be economic, social, emotional, and highly personal for each individual. The maps below consider the distribution of cultural spending in Tacoma by the Tacoma Arts Commission (TAC) in terms of geographic distribution, amount spent, and programmatic focus. For context, spending is presented against backdrops of average income, population density, and average educational attainment for adults over 25. This study exclusively considered data in two funding bienniums, 1999-2000 and 2011-2012, and data is classified into four categories: Operational Funds, Permanent Artworks, Temporary Events and Temporary Projects. Rather than provide a comprehensive picture of spending, these maps create a snapshot of one funder’s shift in focus, geographically and programmatically, over a decade. Understood alongside anecdotal information and personal perspectives, the results can be used to inform both grantmakers and grantseekers of areas where cultural spending could be better leveraged, areas where there is a current lack of investment, areas where the currently funded activity is unsuccessful, and areas where the currently funded activity is making a difference. Together, they compose just one interpretation of the impact of the City’s arts spending in Tacoma.
Recommended Citation
Solverson, Rebecca, "The State of the Arts: A Comparative Study of Public Arts Spending in Tacoma, WA in the 1999-2000 and 2011-201 Funding Bienniums" (2013). GIS Certificate Projects. 74.
https://digitalcommons.tacoma.uw.edu/gis_projects/74
COinS